ferric-fred
FRED — Federal Reserve Economic Data, from the St. Louis Fed — publishes hundreds of thousands of economic time series: unemployment, GDP, interest rates, prices, and a great deal more, all behind a free API. I wanted iron-clad, typed access to it from Rust, so I built ferric-fred.
The name is ferric (iron oxide — rust) + FRED. It is three things that
share one core: a library, a command-line tool with terminal charts, and
an MCP server. The code lives
on GitHub, and all three crates
are published to crates.io.
the library
ferric-fred is a strongly-typed async client. Every FRED endpoint is a request
builder, and every response is a real domain type — dates are NaiveDate, ids
are newtypes, and FRED’s value sets are enums — rather than a bag of
serde_json::Value. If the FRED shape changes under you, the compiler is the
one that tells you.
use ferric_fred::{Client, SeriesId, SortOrder};

#[tokio::main]
async fn main() -> anyhow::Result<()> {
    let client = Client::new(std::env::var("FRED_API_KEY")?)?;
    let observations = client
        .observations(&SeriesId::from("UNRATE"))
        .sort_order(SortOrder::Ascending)
        .limit(5)
        .send()
        .await?;

    for point in observations {
        println!("{}  {:?}", point.date, point.value);
    }
    Ok(())
}
Add it to a project with cargo add ferric-fred.
the CLI
The fred binary is the library’s first consumer. It can search for series,
show metadata, print observations, and browse FRED’s category, release, source,
and tag trees — add --json to any data command to pipe it into jq.
fred search "unemployment rate" --limit 3     # find series by text
fred series GNPCA                             # one series' metadata
fred observations GDP --units pch --limit 4   # transformed observations
fred chart UNRATE                             # an interactive terminal chart
That last one is my favourite. fred chart draws a series in the terminal with
ratatui — a braille line chart with axes, tick labels,
and a one-line summary, live until you press q:
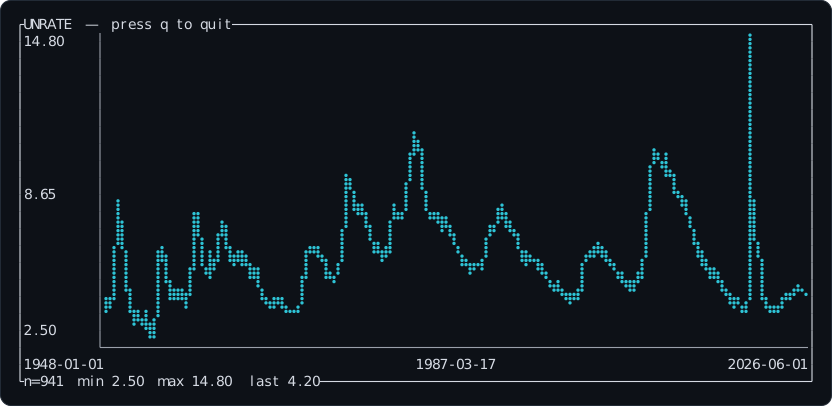
US unemployment since 1948 — fred chart UNRATE. The spike on the right
is 2020.
It works on anything with observations. Here is the federal funds rate over seventy years, from the double-digit early 1980s to the floor after 2008:
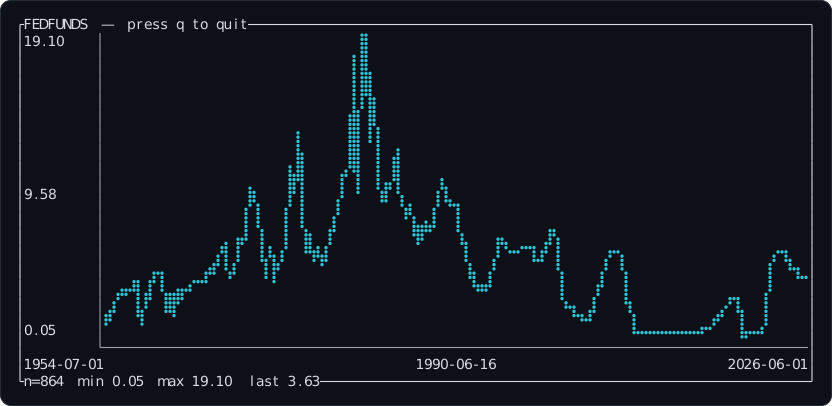
The federal funds rate since 1954 — fred chart FEDFUNDS.
Or something smoother — real GDP is a steady climb, with the 2020 dip about the only break in it across seventy-odd years:
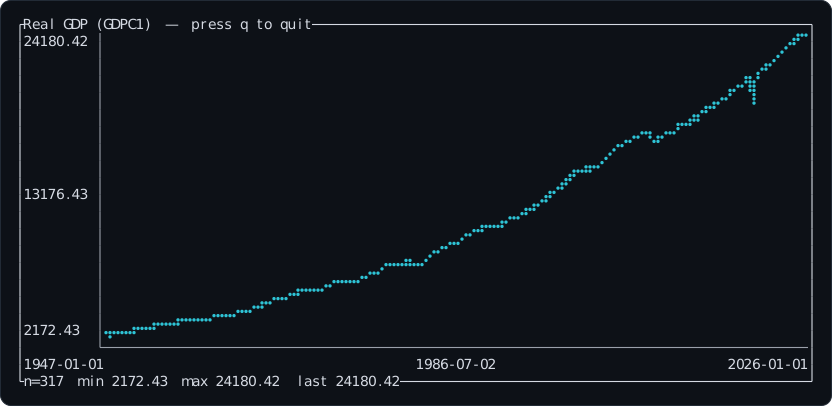
Real GDP since 1947 — fred chart GDPC1.
the MCP server
fred-mcp exposes FRED to MCP clients over
stdio — thirty-one tools covering the same surface as the CLI. The point is to
give an assistant real, current data instead of half-remembered numbers: ask it
to compare unemployment before and after 2020 and it actually calls
get_observations and reads the series back.
Build the server, then point your client at the binary:
{
  "mcpServers": {
    "fred": {
      "command": "/path/to/fred-mcp",
      "env": { "FRED_API_KEY": "your-fred-api-key" }
    }
  }
}
trying it
Grab a free API key from
the St. Louis Fed, export it as
FRED_API_KEY, and install whichever pieces you want:
cargo install ferric-fred-cli   # the `fred` binary
cargo install ferric-fred-mcp   # the `fred-mcp` server
Everything is dual-licensed MIT / Apache-2.0. The repository has the full endpoint coverage, the architecture decisions behind it, and the rest.
← Home